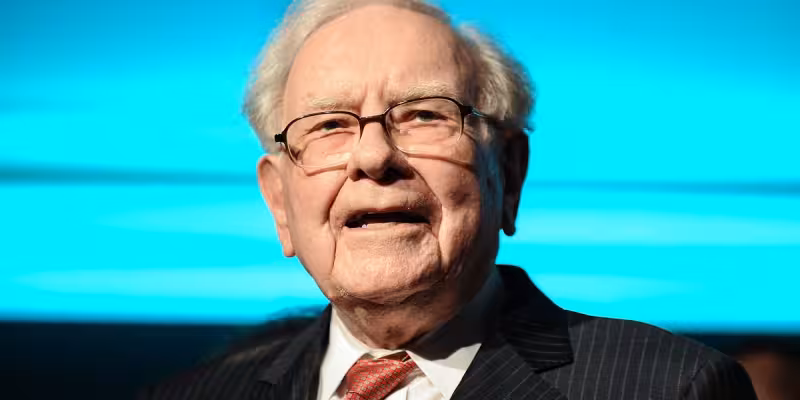
Warren Buffett’s favorite stock-market yardstick is flashing a warning again. The Buffett Indicator has climbed to 227%, even after the S&P 500 rebounded to a near all-time record of 7,165 following the surprise start of the Iran war.
The reading is about one-sixth higher than the level Buffett once called “playing with fire.” He wrote in a 2001 Fortune story that when the ratio of total U.S. stock market value to national income approaches 200% — as it did in March 2000 at the peak of the dot-com bubble — investors are taking dangerous risks. The current figure is also well above the 200% mark that briefly returned in November 2021 before tumbling 19% in the months that followed.
The Buffett Indicator compares the total value of U.S. stocks with national income, and Buffett has long used it to judge whether the market is undervalued, fairly valued or overheated. At 227%, the measure is sitting above his historical warning level even after the latest rebound in shares. That matters because the market’s comeback has not erased the underlying valuation problem; it has only pushed prices back near record territory.
There is another pressure point under the surface. Profits now account for 12% of GDP, while the historic average share is 7% to 8%. The S&P 500 is also trading at more than 28 times forecast first-quarter GAAP net earnings, a price/earnings ratio that is two-thirds higher than the 100-year average of about 17. Milton Friedman once argued that corporate earnings as a share of national income cannot rise beyond their historic share of GDP for long periods, a view that helps explain why the present gap looks hard to sustain.
That is the tension in Buffett’s signal: for the indicator to fall meaningfully, either stock prices would need to cool or profits would need to shrink back toward normal relative to the economy. Buffett’s own benchmark has now been exceeded, and the last two times the measure reached this neighborhood — March 2000 and November 2021 — the story ended with a sharp reset. Mid-2022 brought the indicator below 80% after the tech rampage’s aftermath, but today’s 227% reading puts the market back in the zone Buffett warned about more than two decades ago.